To get a general idea of the Green Map- you can see our first post here. Otherwise, dive into some details and then give us your feedback!
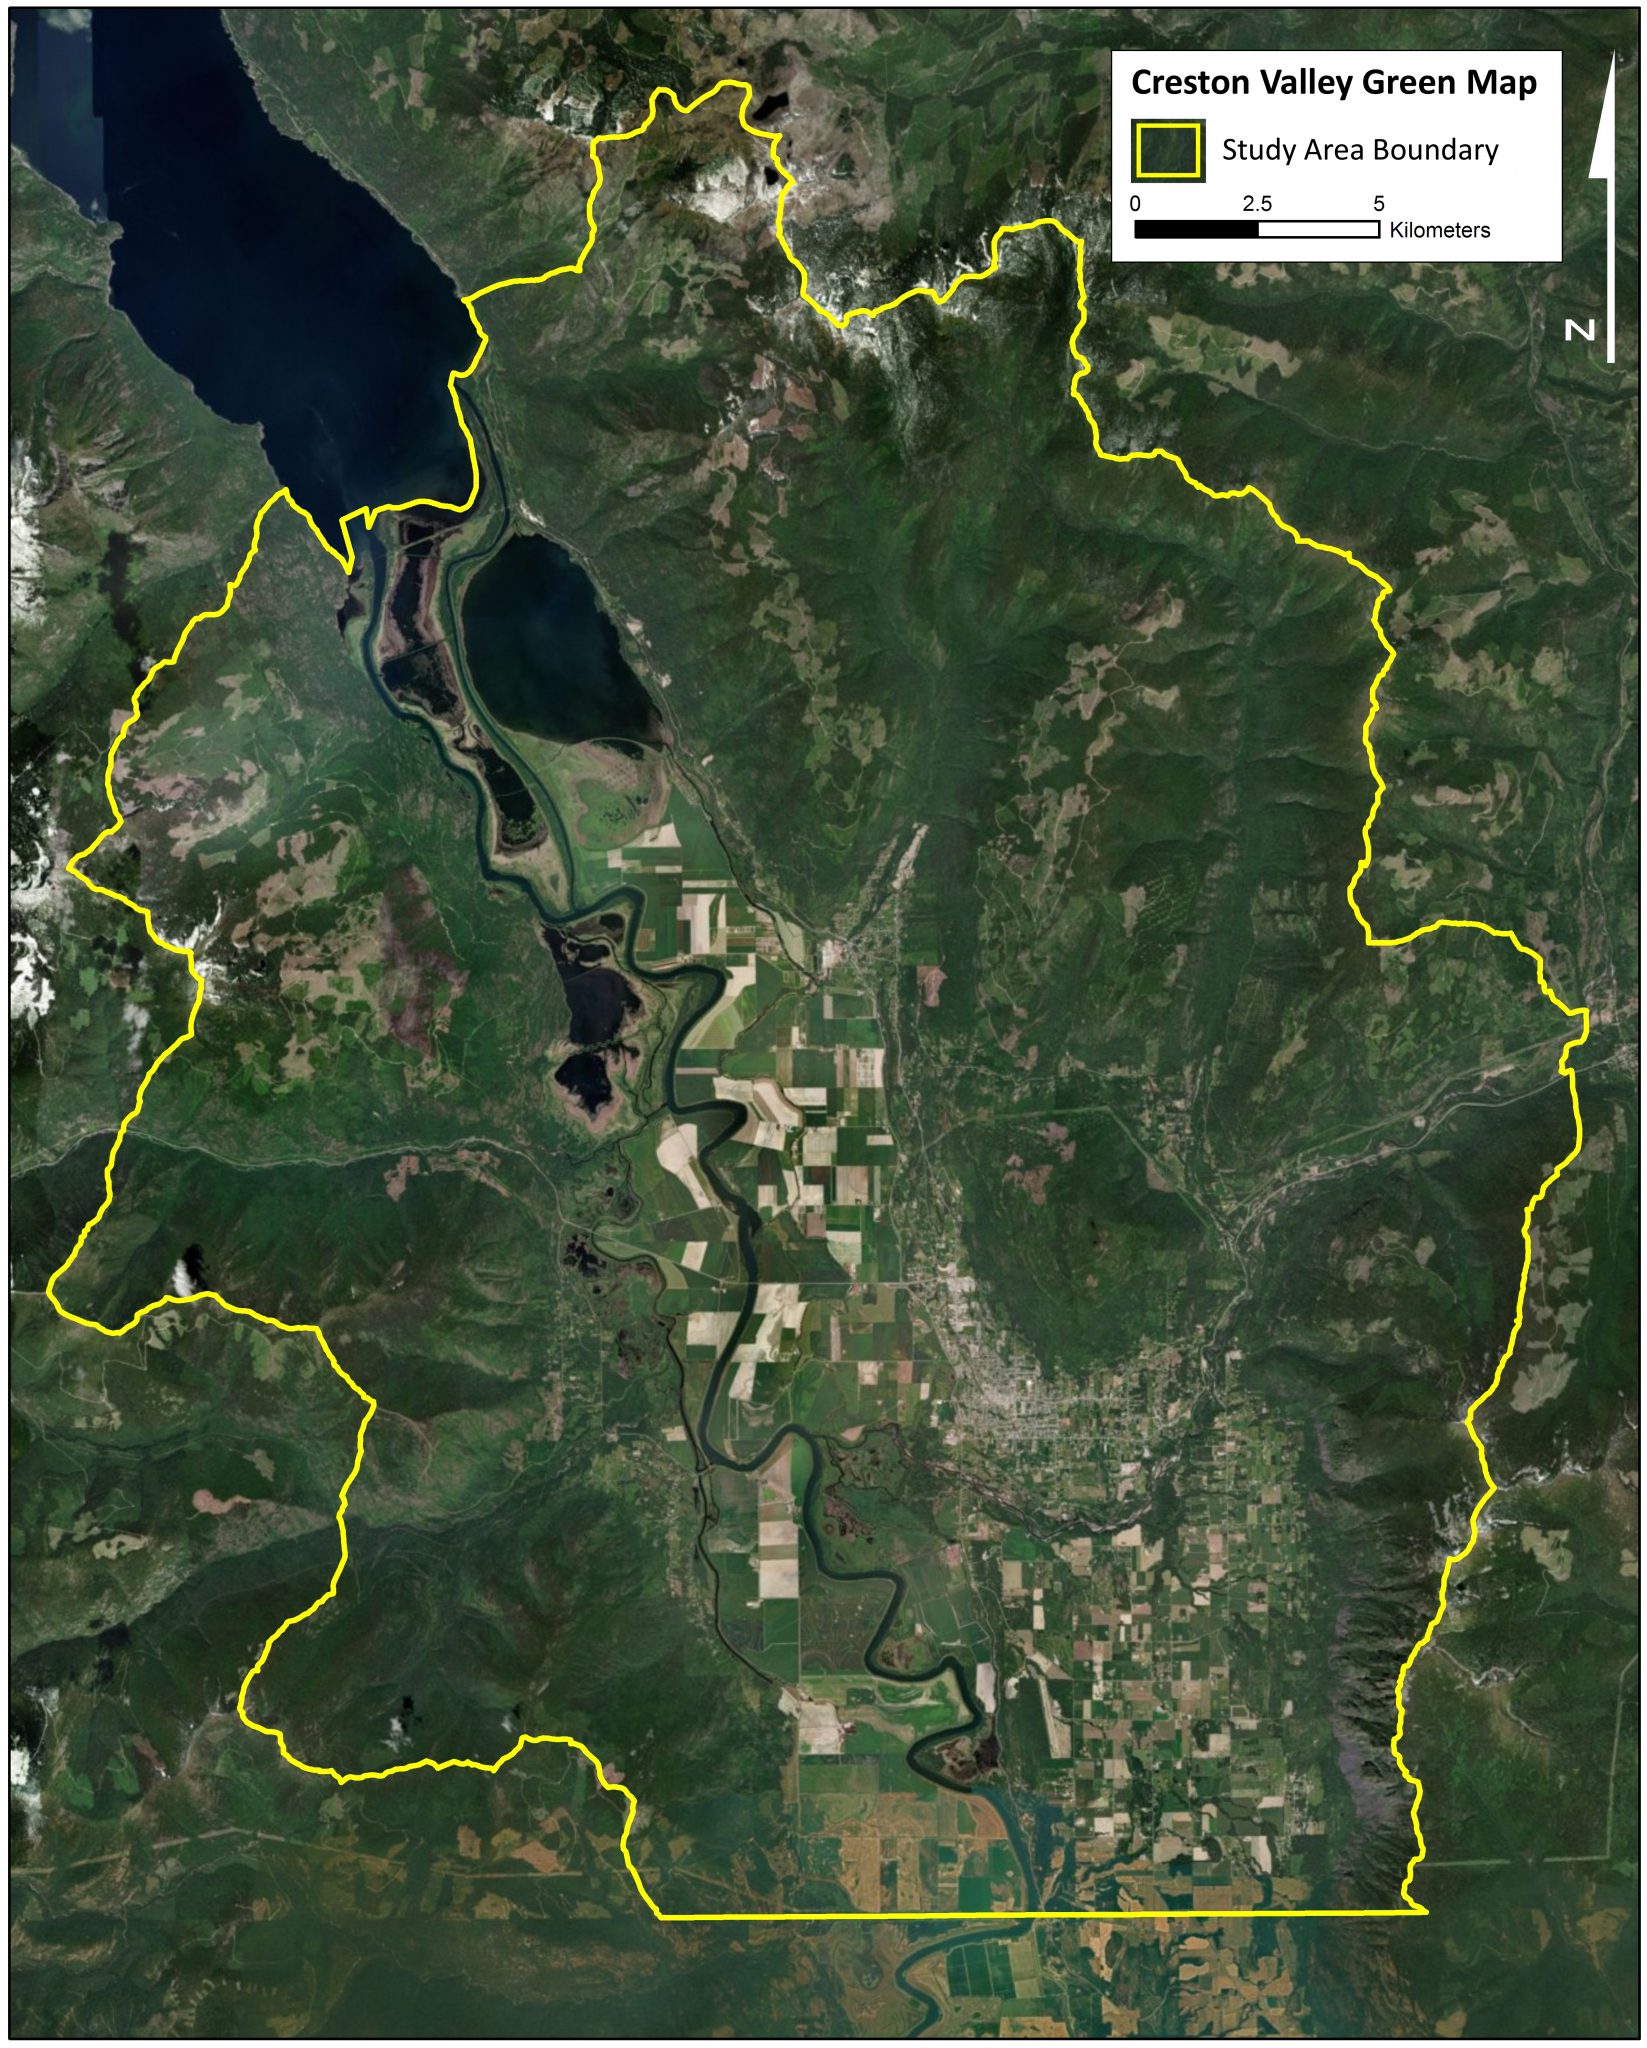
Building a Map
The Creston Valley Green Map is built from 28 data sets. Some data sets, or layers, are based on natural features like forest cover or ecosystem type. Other data sets come from human infrastructure like road density and private property lines. Some layers are established government sources, and some are generated from recent scientific research. Data layers were grouped and analyzed by theme. The Green Map has the following six themes: i)Conservation Areas Gap Analysis, ii)Rarity, iii)Wildlife, iv)Forest and Floral Attributes, v)Human Footprint and vi) Geotechnical Risk Factors. Each analysis ranked 25m by 25m map areas for value. Value was determined by theme. For example, areas were ranked for rarity of ecosystem type in the Rarity Theme. The top rankings were converted into coloured shapes, or polygons, and depicted on the map.

1. Conservation Gap Analysis
This first theme asks: are all types of habitats represented in protected areas? For example, if a particular ecosystem represents 15% of the Creston Valley, does that ecosystem exist in 15% of protected areas? Conservation can be biased towards protecting land left over from development, and not the most ecologically representative areas. In this theme, the Green Map looks at what ecosystem types are under-represented provincially and locally. Two data sets were used: Biogeoclimatic (BEC) Zones or ecosystem types, and Leading Tree Species from the Vegetation Resources Inventory (VRI).

In the Creston Valley, ecosystem types that are not well represented in protected areas, are mid-slope forests. Specifically, the ‘Dry Interior Cedar Hemlock’ BEC zones are highlighted as conservation gaps in the Creston Valley Green Map. A conservation opportunity could be to include mid-slope habitat into future wildlife corridors.

What types of habitats do you think are missing from conservation areas in the Creston Valley? Why?
Data Sets:
-
2017 Biogeoclimatic Ecosystem Classification (BEC, version 10)- ecosystem classification based on the interactions between climate and soil to determine the vegetation on a site.
-
Vegetation Resources Inventory (VRI). Photo-interpreted vegetation inventory that is geared mostly towards forestry applications. Leading Tree Species are the tree species that dominate a stand of forest.
2. Habitat Rarity
Rare habitat types are already limited on the landscape, and are thus more sensitive to disturbance and disappearance. In addition, rare habitats may be specialized habitats with high biodiversity. Three data sets were used for this analysis. The six BEC zones of the Creston Valley were ranked for provincial rarity. Then, the Predictive Ecological Mapping (PEM) sites were ranked for rarity in the Creston Valley. Lastly, stands with rare Leading Tree Species were highlighted from the Vegetation Resource Inventory (VRI). When these three data layers were amalgamated, riparian habitat and ridge top habitat were rarest. Areas highlighted in this theme are the riparian habitats around Duck Lake, Corn Creek and Goat River. Ridge top habitat also ranked as rare in the Creston Valley.

What habitats do you think are rare in the Creston Valley? Why?
Data Sets:
-
2017 Biogeoclimatic Ecosystem Classification (BEC, version 10)- ecosystem classification based on the interactions between climate and soil to determine the vegetation on a site.
-
Predictive Ecological Mapping (PEM) for the Kootenay Lake area. Detailed model of what ecosystem is expected given climate and biophysical aspects of the land.
-
Vegetation Resources Inventory (VRI). Photo-interpreted vegetation inventory that is geared mostly towards forestry applications. Leading Tree Species are the tree species that dominate a stand of forest.

3. Wildlife Values
There are many types of wildlife ranging from slugs, herons, turtles, dragonflies to moose, coyote, and bear. High-quality habitat is different for the various species. Here, we used species at risk and ungulates to map out important wildlife habitat. Ungulates are hoofed animals like deer, elk, moose and caribou. They were used as proxy for ecosystem health in this analysis. Species at risk were integrated because they are essential to biodiversity conservation. Species at risk are ranked provincially as red-listed and blue-listed. Red-listed means the species is endangered or threatened. Blue-listed means the species is of special concern and vulnerable. For example, Sturgeon are red-listed, and their habitat in the Kootenay River was integrated into the analysis. To produce the wildlife values map, we incorporated data from: ungulate habitat suitability models, ungulate winter ranges, cost to travel to water, and locations of BC blue and red-listed wildlife species.
The analysis showed that the highest quality wildlife habitats are in the valley bottom. Particularly, Kootenay River and associated wetland habitats were ranked very high. High elevation habitat is important for caribou and steep low elevation slopes are important winter habitat for ungulates.

Do you know any important habitats for wildlife? Salt licks? Wintering areas? Breeding areas?
Data Sets:
-
Game animal suitability and high quality habitat model
-
Ungulate Winter Ranges, BC Forest and Range Practices Act
-
Cost to travel to water sources
-
Blue and Red listed animal species from the Conservation Data Centre of BC

What did you think of the first three themes of the green map? Does it change how you see certain parts of the Creston Valley? Give us your feedback!
Stay tuned for more on map themes in our next post!
Thanks to Yann Troutet, Yellowstone to Yukon Conservation Initiative and Selkirk Geospatial Research Centre for collaborating on this project.